
Forecast
SUMMARY
Introduction
Overview
Being predictable is very important and desirable within an organization, especially when it comes to planning in the financial and controlling areas. Thus, it is prudent that the company creates and plans its forecast scenarios to better support decision making and data comparison in the near future.
Accountfy enables this forecast and comparison through its Forecast mode, where the user can create or import (from spreadsheets) his personalized budget and forecast scenarios, compare them with Realized Values, view them in individual posting within the financial account (detailed form) or through structure aggregators (simplified form), as well as create formulas to fill in the scenarios, manually insert entries in the scenarios, block editing in a specific scenario, and editing an already created scenario.
Filter
In an already created scenario, you can filter the results in the Income Statement, Cash Flow, and Balance Sheet tables, as shown below:

Clicking on the arrow icon (1), the filters section will open, and will allow you to filter the other tables on the Forecast page from the elements listed under View (2), Companies (3), Tags (4), Cost Centers (5), and Consider (6), where you can choose whether or not to consider the Realized Values for the YTD (year to date), as well as the Realized Values that are not allocated to any cost center. The attributes determined in the filters will be applied to the tables on the Forecast page when you click Apply (7).
How to reprocess the scenarios
Once you have edited the Forecast scenarios, whether in a detailed form (individual entries within the financial account) or simplified form (through structure aggregators), you will need to reprocess the scenarios so that the changes are applied to the Forecast tables:

To reprocess them, you need to click on the icon in the upper right corner of the Forecast module (1) and then click on the Reprocess Scenario option (2), as shown above.
Table structure
For easier viewing, we can rearrange the order in which the tables are displayed within the Forecast scenario. When entering the Forecast mode, click and hold the movement icon (1) and drag it to modify the order of the tables, as shown in the demo below. As you drag them, a contracted view of the tables will appear on the screen to make the sorting process easier.

Expand and collapse all structures at once
You can also expand or collapse all structures at once within the Forecast scenario tables. For further instructions on how to do this, visit our knowledge base.
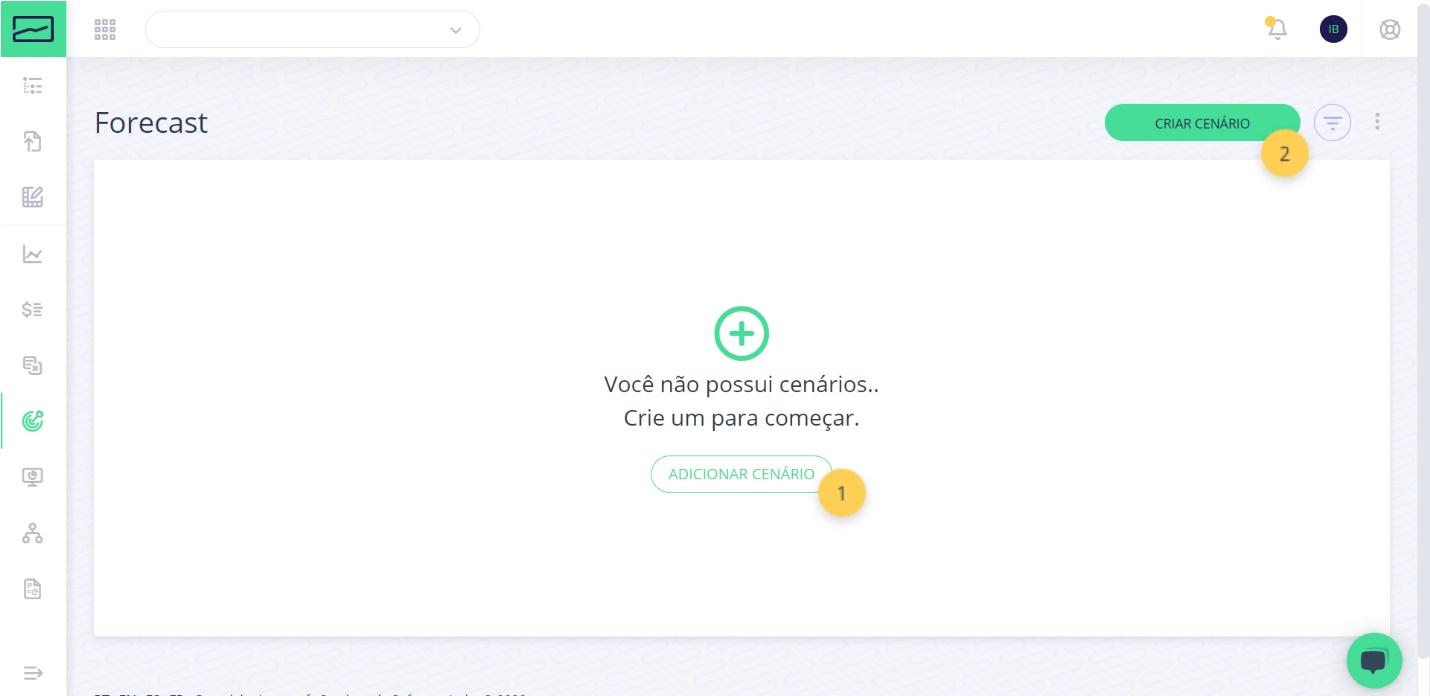
How to create a scenario
As mentioned previously, to use the Forecast module it is necessary to create at least one scenario. For the creation of the first scenario, two buttons make this action possible, the first one centered on page (1) and the second one in the upper right corner (2), as shown below:
By clicking on any of the buttons, the scenario creation module will appear on the screen, as below:

To create the scenario, some information must be entered in the module in question:
- Scenario name: the name you choose to assign to the scenario in question;
- Reference date: last accomplished month to which you want to bring reference;
- Number of Realized Value Columns – i.e., the number of months you want to bring in starting from the Reference Date, in descending order. E.g: If the Reference Date is set to “12/2019” and the number of Realized columns to “2”, the scenario will import the Realized value columns for the months 11/2019 and 12/2019.
- Create M-1 entries for the financial statements balance: bring the entries according to the last period (Reference Date) to create the entries in the Liabilities and Assets structure, making the correct variation in the Cash Flow.
- Copy data from another scenario: an option that allows you to copy data that has already been imputed in other scenarios, thus facilitating the creation of scenarios that contain small differences in assumptions. This option is possible only if other scenarios have already been created.
- Select a scenario: if the checkbox in the previous option (Copy data from another scenario) is selected, this option is opened for the user to select the base scenario for copying.
Once all the particularities and characteristics of the scenario have been defined and filled in, just click on Create scenario, at the bottom of the mode.
Preferences
In the Forecast mode, you can set some usability preferences. To open the mode, click on the icon in the upper right corner of the screen (insert icon) and then the Preferences button, as shown below:

After the process is done, the following module will open showing some predefined preferences that can be customized by the user:
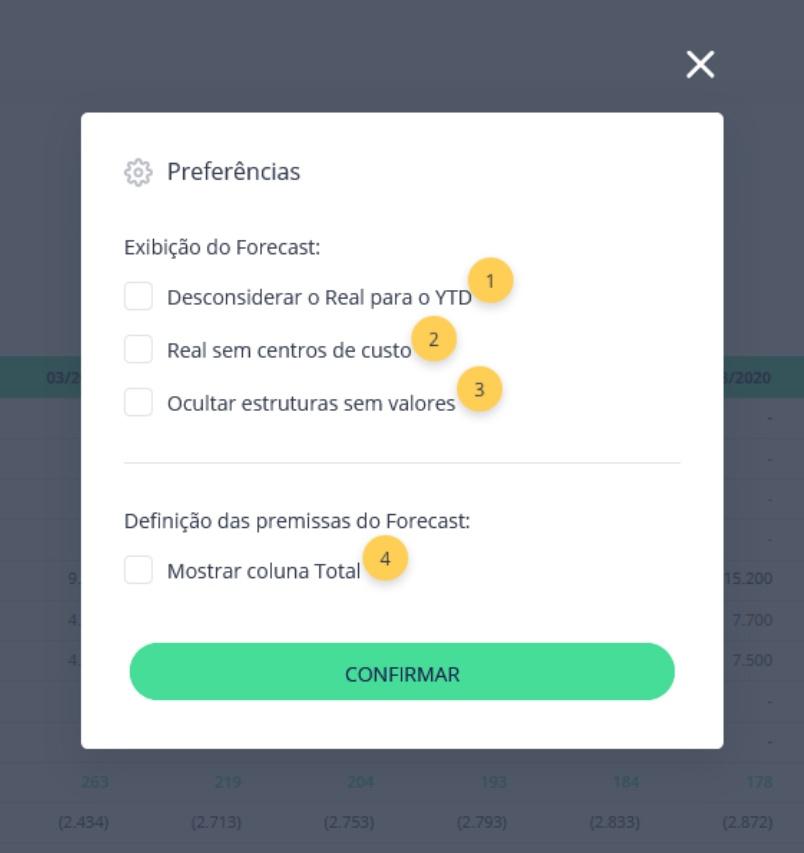
In the Preferences mode, you can find the following options for user customization:
- Disregard the actual to YTD: do not consider the reference Realized results in the Year To Date summation brought in the last column of the Forecast tables;
- Actual without cost centers: whether or not to consider the actual values without a filled cost center;
- Hide structures without value: option that allows hiding the structure lines that are not filled in or have a result of zero;
- Show Total column: option to insert or not a column for the summation of Achieved and Forecast at the end of the tables.
How to import Forecast
In the Forecast mode, you can import a spreadsheet with the forecast entries to facilitate the scenario filling. To access the import mode, simply click on the icon in the upper right corner of the screen, and then click on Import Forecast, as shown below:
By clicking on the Forecast Import button (2), a module opens with the import instructions and details, as shown below:

- Select file: file input field, where the file will be available for review once it is selected;
- Select: Button to open your computer’s file explorer and select the appropriate file for importing;
- Scenario: dropdown for selection of the scenario to which the import will be applied. In this dropdown, only previously created scenarios will appear;
- Overwrite existing entries: checkbox that indicates if the new entries that will be loaded with the file input should overwrite and replace any pre-existing entries in the scenario;
- Budget Import: button that imports the xls or xlsx file selected in the Forecast scenario after the information is filled in;
- Export Financial Accounts: in this section, there is a part destined to the spreadsheet model that must be used when importing the Forecast entries. Above this option you will find a brief description of how the template works, and here is where you choose whether the template worksheet is to be downloaded already with the financial accounts filled in according to the information fed into the Economic Group, within Accountfy;
- Download template: button to download the default import spreadsheet template based on the details defined above.
Accountfy Model Explanation

As seen in the topic above, within the Import-Mode, in the Forecast Mode, it is possible to download a spreadsheet template used to ease the import of Forecast entries. The spreadsheet is divided into several columns to organize the information:
- Type: describes the type of entry structure (0 – Simplified, 1 – Detailed, or 2 – Section);
- Id: Accountfy’s internal Id responsible for identifying the entries structures;
- Account: identification of the financial accounts related to the entries. If, when downloading the template, the user has already chosen to export the financial accounts as well, this column is already filled out;
- Description: Description of financial accounts. This information is already filled in when downloading the template;
- Company classification: column with the name of the company to which the entry is related
- Cost Center: column for describing the cost center of the posting;
- Entry: column to be filled with the desired description of the entry;
- Month 1 to Month 12: columns to be filled with the monthly value of the Forecast scenario;
- Columns U onwards: allocated to the filling of labels. When the labels are created, the template download will automatically name the columns with the appropriate correlated labels.
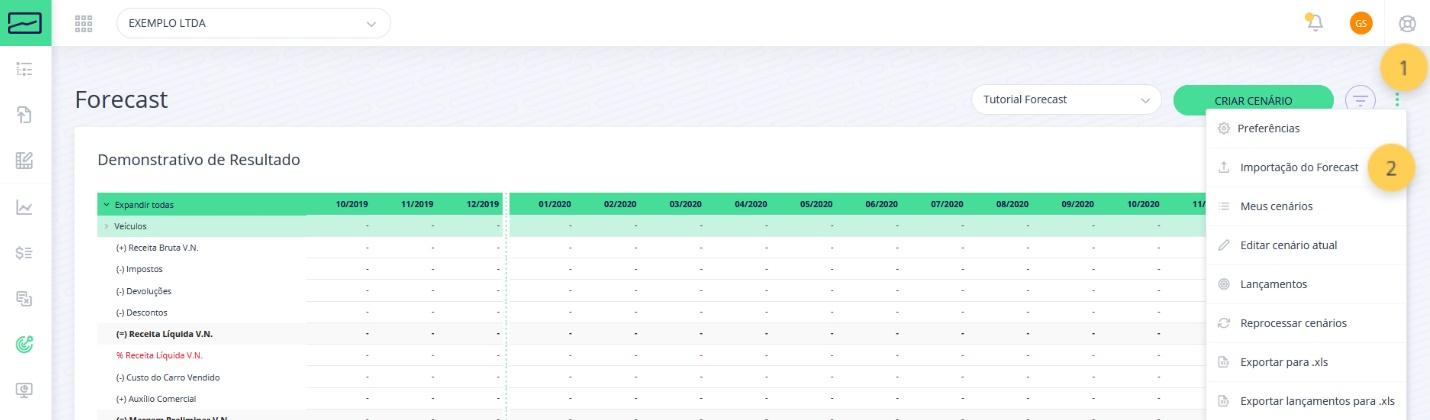
My Scenarios
In the Forecast mode, you can view all the scenarios created and edit some of their preferences. To do this, access the mode, look for the icon in the upper right corner of page (1) and click on My Scenarios, as shown below:
By clicking the My Scenarios button, you can view all the scenarios to which you have access and also configure some of their options, as shown below:
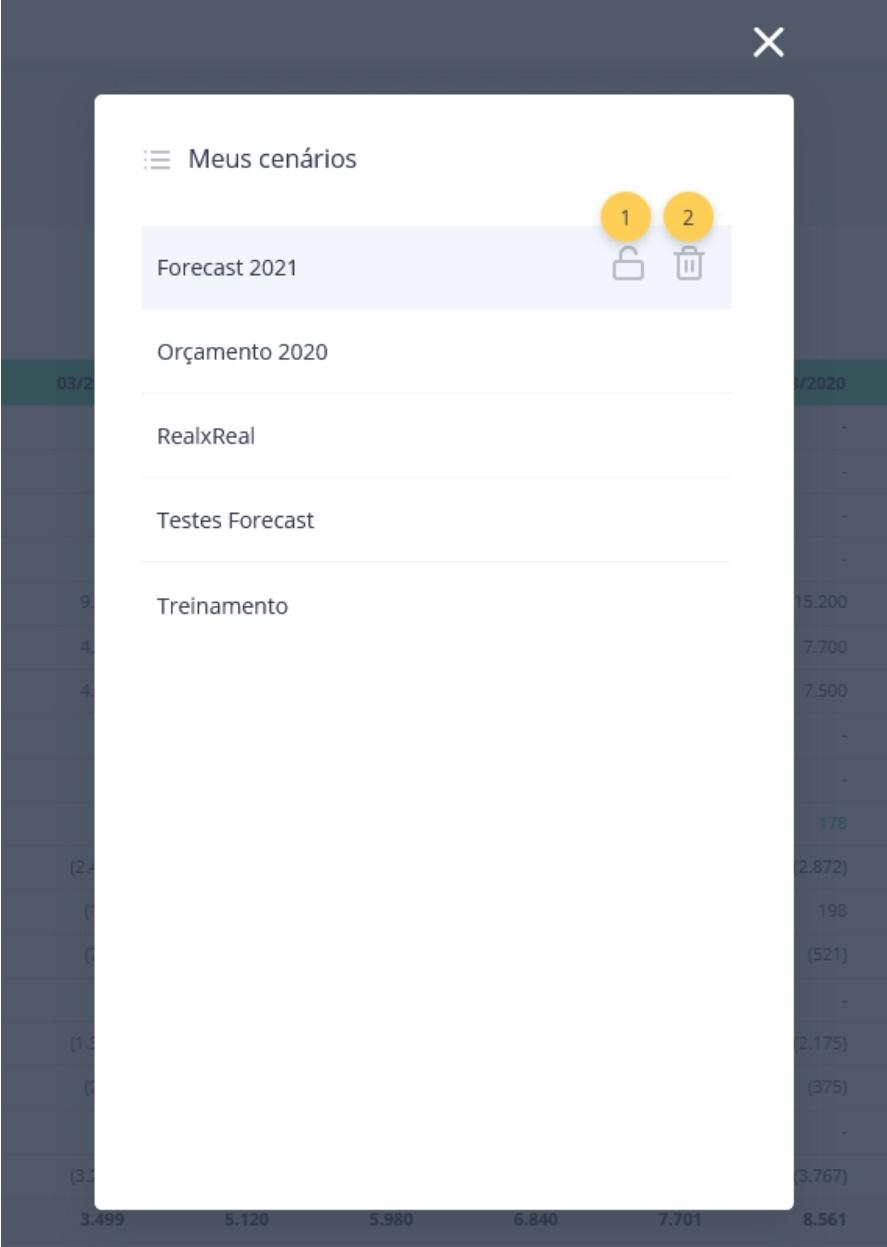
When you place the mouse over any of the scenarios, two options are released for configuration:
- Block scenario: by clicking this option, the scenario is blocked for attempts to change information by any user;
- Delete scenario: the selected scenario is deleted.
Edit current scenario
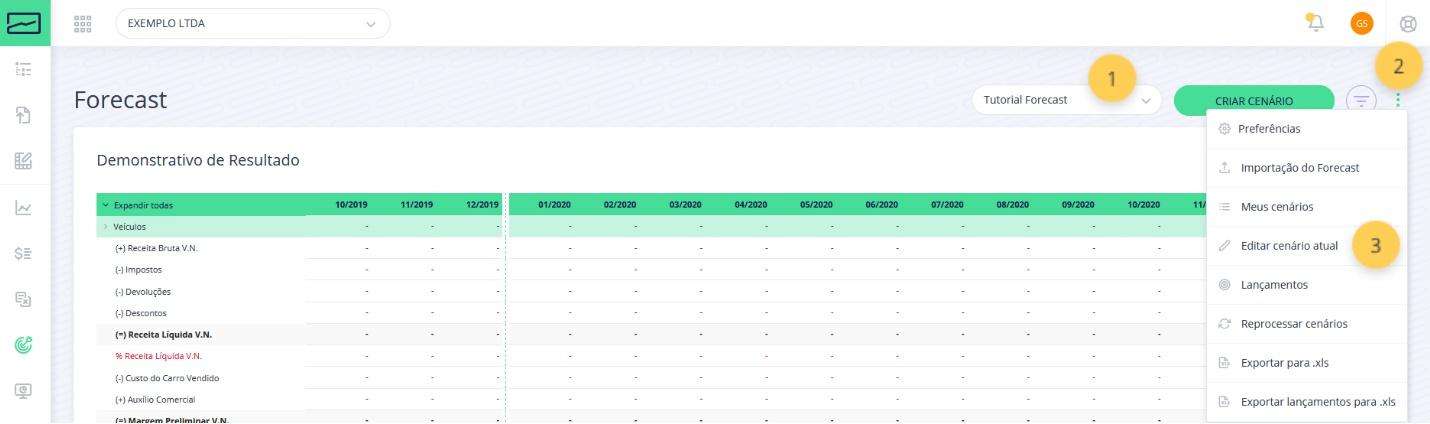
Within the Forecast mode, you can also edit the scenarios already created. When you enter the mode, simply select the desired scenario from the scenario dropdown at the top right corner of the screen, click on the icon, also placed at the top right corner of the screen (2), and click on the Edit current scenario button (3), as shown in the following image:
When you click the Edit Current Scenario button, a scenario editing module opens for adjustments to be made, as shown below:
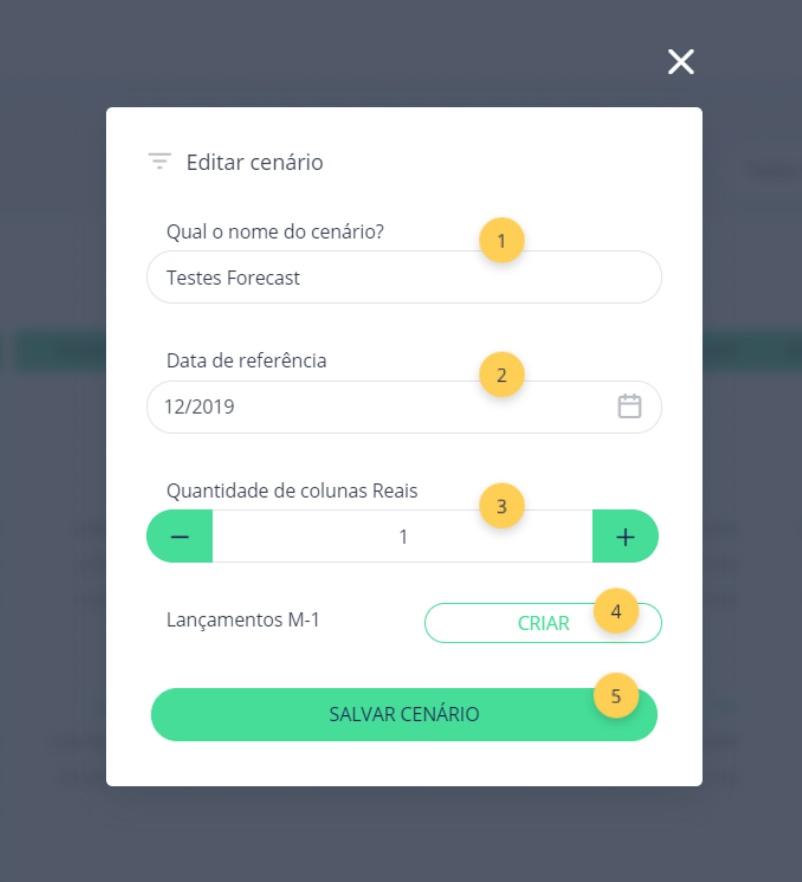
- What is the name of the scenario: field to edit the name chosen for the scenario;
- Reference date: field to edit the Reference date, which is the last month to which you wish to bring the reference;
- Number of Realized Value Columns – i.e., the number of months you want to bring in starting from the Reference Date, in descending order. E.g: If the Reference Date is set to “12/2019” and the number of Realized columns to “2”, the scenario will import the Realized value columns for the months 11/2019 and 12/2019.
- M-1 Entries: field for editing the M-1 entry creation option; an option that brings the entries according to the last period (the reference date) to create the entries in the Liabilities and Assets structure, making the correct variation in the Cash Flow.
- Save scenario: button to save the changes made in the Forecast scenario being edited.
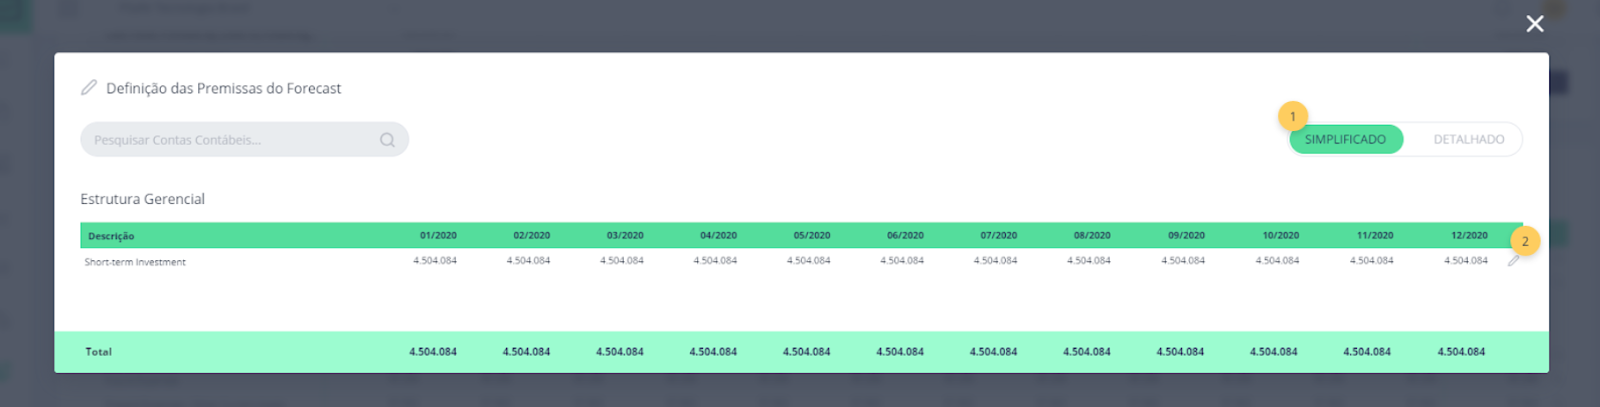
Forecast assumptions definition
To access the Forecast assumptions definition mode, you must first click next to the line of a management structure, either of a Statement of Income or a Balance Sheet:
Simplified view
The simplified version shows the values of the monthly entries for 12 months, and you can edit these values by clicking on, on the right side of the line:
Editing Entries
The values of an entry can be composed of a number directly imputed into the # or else derived from a formula f(x).

- To create an entry, click on the , next to the top bar.
- If you want to edit the values of an entry, select the # or the formula f(x) and confirm the action by clicking the icon.

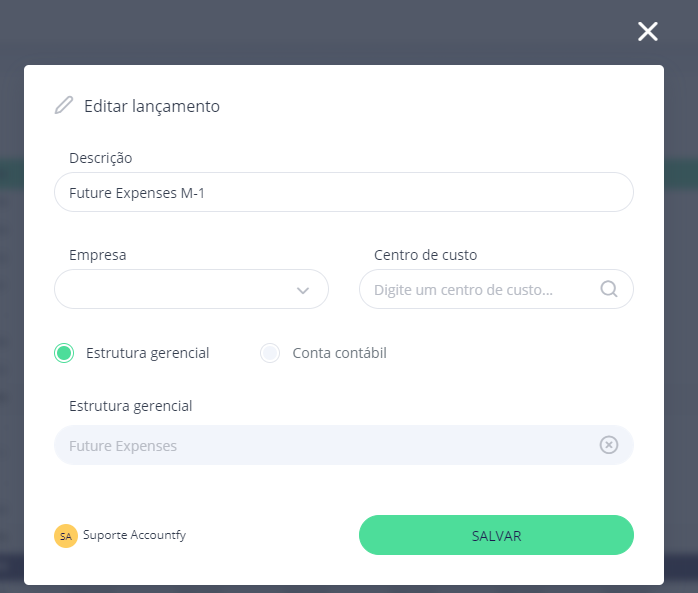
3) Editing the name, cost center and company is done in the icon.
4) Deleting an entry is done using the icon of .

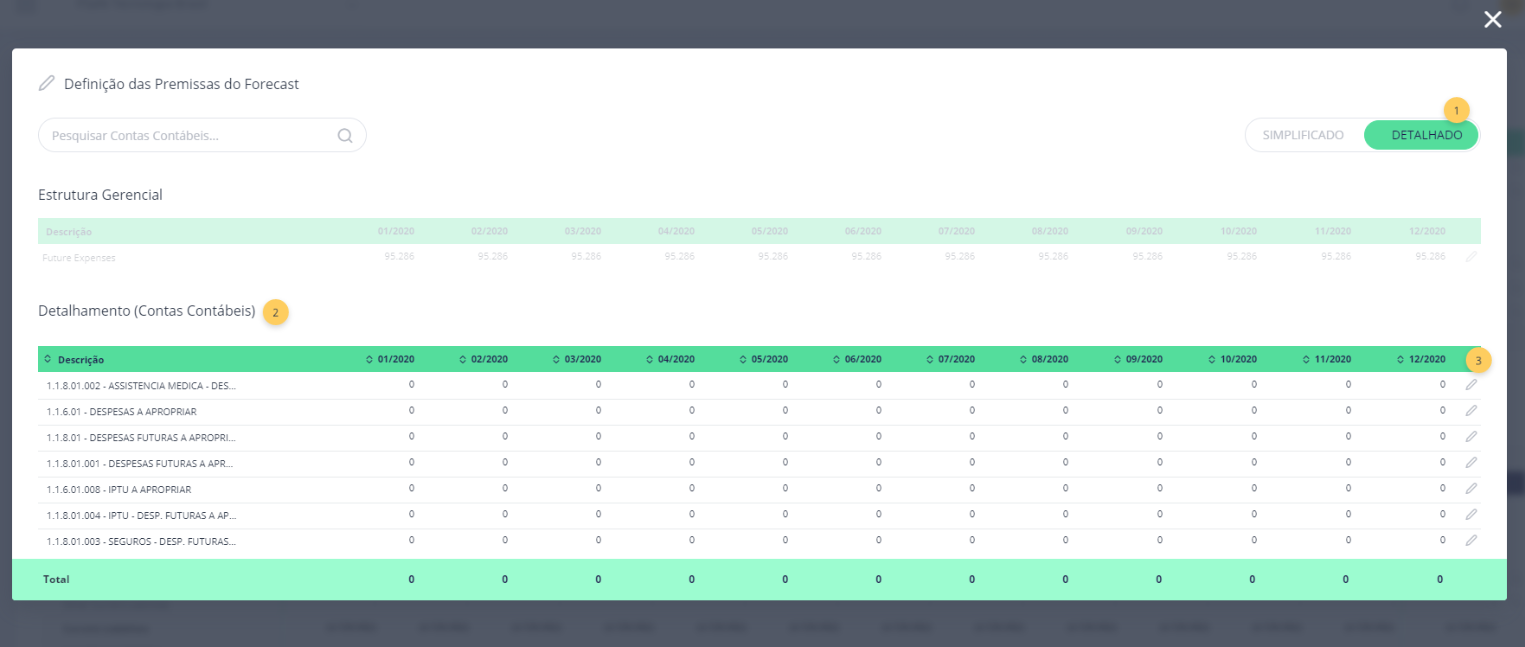
Detailed View
In Forecast assumptions definition mode, there is also a detailed view of the entries, where the details of the financial accounts are displayed.
Financial Accounts Breakdown
In the detail section, the value of each of the financial accounts that comprise the value will be described, along with their total.
Editing Entries
You can edit a posting from a financial account using the icon. The process is the same as for a posting from a Management Structure.

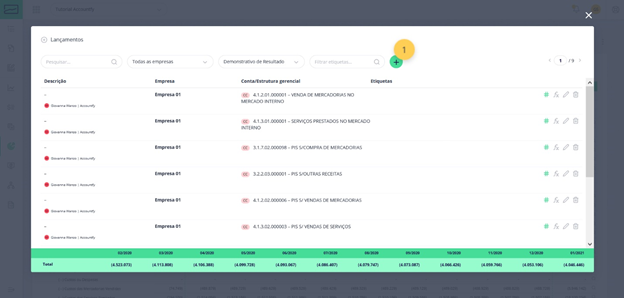
Entries
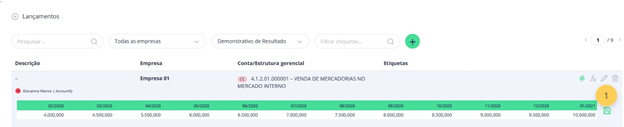
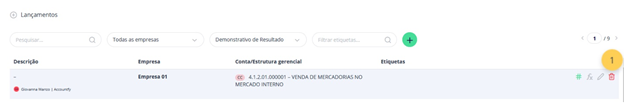
In this mode, it is also possible to view the entries in detail and their individuality. To access the entries section in Forecast, just click on the icon in the upper right corner of the screen (1) and click on the button Entries (2), as shown below:

Filters
Clicking on the Entries button opens the module for individual viewing. In it, Accountfy enables an organization by filters. See below:

- Search box: field that allows textual filtering. You can use this field to filter the columns for Description, Author/Editor, Company, Account/Management Structure, and Labels;
- Company Filter: dropdown for selecting and filtering entries by the company;
- Structure Filter: dropdown for structure filter (Income Statement, Assets and Liabilities);
- Label Filter: text field for filtering entries by a label.
Creating Entries
To create new entries in the Forecast module, go to the Postings module and look for the icon , as exemplified below:
By clicking on the icon, a model for creating new entries will open, as shown in the following image:

1) Description: text field to describe the entry;
2) Company: dropdown with the companies registered in the Economic Group, enabling the user to link the entry to a specific company;
3) Cost Center: field with autocomplete of the Cost Centers already registered in the platform, to link it to an entry;
4) Posting Classification: field to choose whether the entry will be registered in a management structure or a financial statement account. According to the choice of this field, the following will also be changed for this correspondence;
5) Management Structure / financial Account: field with autocomplete of the structures or financial accounts registered on the platform, allowing the linking of the entry to them. This field changes with the correspondence selected in the previous field;
6) Label: field with autocomplete of the labels registered on the platform to link the entry in question with any registered label;
7) Create Entry: button to save the characteristics described in the module and create the entry in question.
Editing Entries
To edit an already created entry, whether it was imported or made on the platform itself, simply click, in the entry mode, on the icon of the entry you want to edit, as shown below:

By clicking on the button described, the user will have access to the editions of the chosen entry, as per the representation:

- Description: text field to describe the entry;
- Company: dropdown with the companies registered in the Economic Group to link the entry to a specific company;
- Cost Center: field with autocomplete of the Cost Centers already registered in the platform for the posting to be linked to a Cost Center;
- Posting classification: Field to determine whether the posting will be recorded in a management structure or financial account. According to the choice of this field, the following field will also change for this correspondence;
- Management Structure /financial Account: field with autocomplete of the structures or financial accounts registered on the platform to link the posting to them. This field changes with the correspondence selected in the previous field;
- Label: field with 1 of the labels registered in the platform to link the entry in question to any registered label;
- Save: button to save the edits made in the entry.
Defining values
In addition to the structural edits of the entries, you can also edit their values via the entry modal. To do so, look for the values icon (1) of a specific entry, as exemplified:

By clicking on the described icon, a section with the monthly values registered for that specific entry will open, allowing individual editing (by double-clicking on the value) and saving them, as shown:
Defining formula
In the Entries mode, you can define that the values allocated there comply with a predetermined formula. To access the formula module for the posting, simply click on the formula icon (1) in the row of the entry you want, as shown below:

By clicking the indicated button, the user will have access to the formula configuration mode. For more information on how to create your custom formula click here.
Exclusion
You can also delete previously created entries in this mode. To do so, find and click the icon in the row of the entry you want to delete, as below:
By clicking on the indicated icon, a new module will appear on the screen warning that a deletion action will be performed, asking for user confirmation. To confirm, click the Ok (1) button, as shown below:

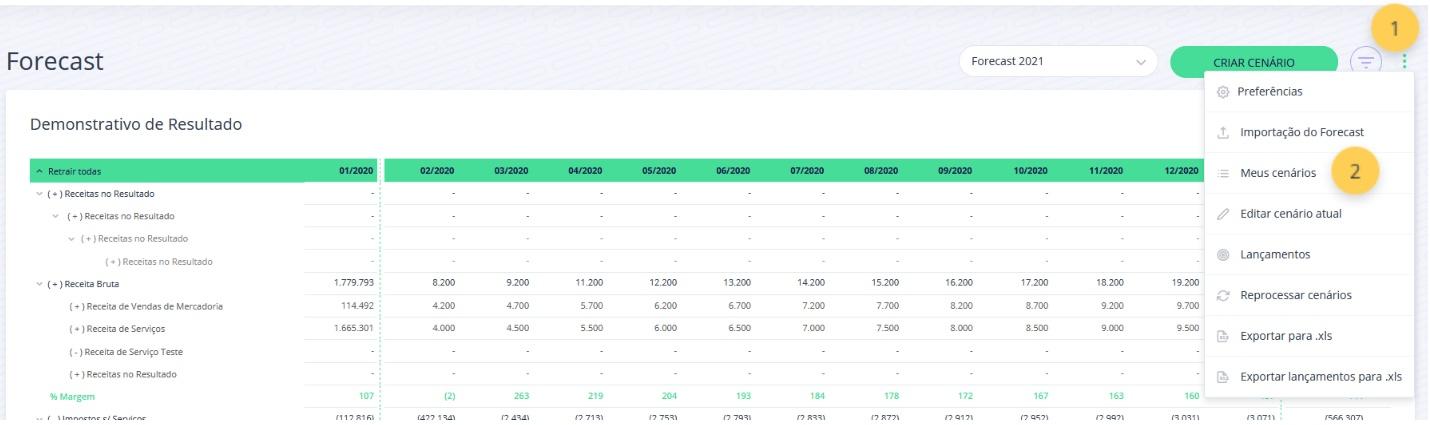
Exporting Scenarios and Entries
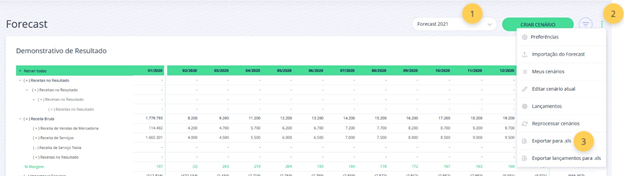
In the Forecast mode, it is possible to export a selected scenario (1). To do this, click on the upper right corner of the screen (2) and then click Export to .xls (3), as shown below:
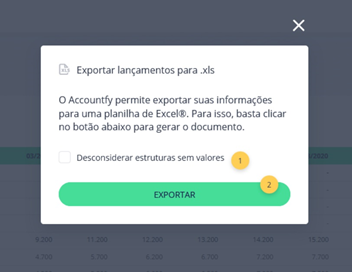
Then a new module with the export instructions will open so that the user can finalize it, as shown in the following image:

- Disregard structures without values: checkbox to determine if structures without values or equal to zero will be exported to the xls document;
- Export: button to confirm the export and download of the xls document.
You can also export the entries of the selected scenario (1). To do this, simply click on the button in the upper right corner of the screen (2), and then Export entries to .xls (3), as shown below:

A new module will open with the instructions for exporting the entries so that the user can finish it, as below:
- Disregard structures with no values: checkbox to determine if structures with no values or equal to zero will be exported to the xls document;
- Export: button to confirm the export and download of the xls document.